OWASP Zed Attack Proxy (ZAP) is an integrated tool dedicated to penetration testing that allows to identify vulnerabilities in Web apps and Websites. It’s an easy and flexible solution that can be used regardless of the proficiency level: it’s suitable for anyone, from a developer at the beginning with pentesting to professionals in the field.
ZAP is composed by two macro-section. The first one is an automated vulnerability scanner that can identify problems and provides a report for developers, sysadmins and security pros with all the details of discovered vulnerabilities in order to fix them.
The second one allows ZAP to work as a proxy and inspect the traffic and all HTTP/S requests and events -- there’s also the interesting capability of modifying them to analyze behaviour that differentiate from the norm or analyze their triggers which can be harmful to the system.
Given its risky nature and being a very powerful tool, its use must be limited to environments where you have the consent to perform test and the assurance that no permanent damage can be done, as some form of safeguard of the Web app is present.
The target audience is mainly composed by security pros, pentesters and developers, but it’s not limited to these ones: ZAP has a wide and precise documentation, and OWASP offers plenty of educational resources on the matter.
Installation
One of the points of strength of ZAP is its availability for many platforms and operating systems: we have tried it on a Windows environment, but it can be installed on Linux and macOS as well. You can download it here.
The only requirement is the presence of Java 7 or more recent on Windows and Linux, the version for macOS already provides Java 8.
Being so flexible, ZAP can be used as a Docker container through a browser (how-to guide here), with Kali Linux (the pentesting-specific Linux distro) or with a simple Raspberry PI (dedicated ISO image).
The installation procedure on Windows follows the usual process of executable files, with EULA, custom options and finalization.
Graphical User Interface
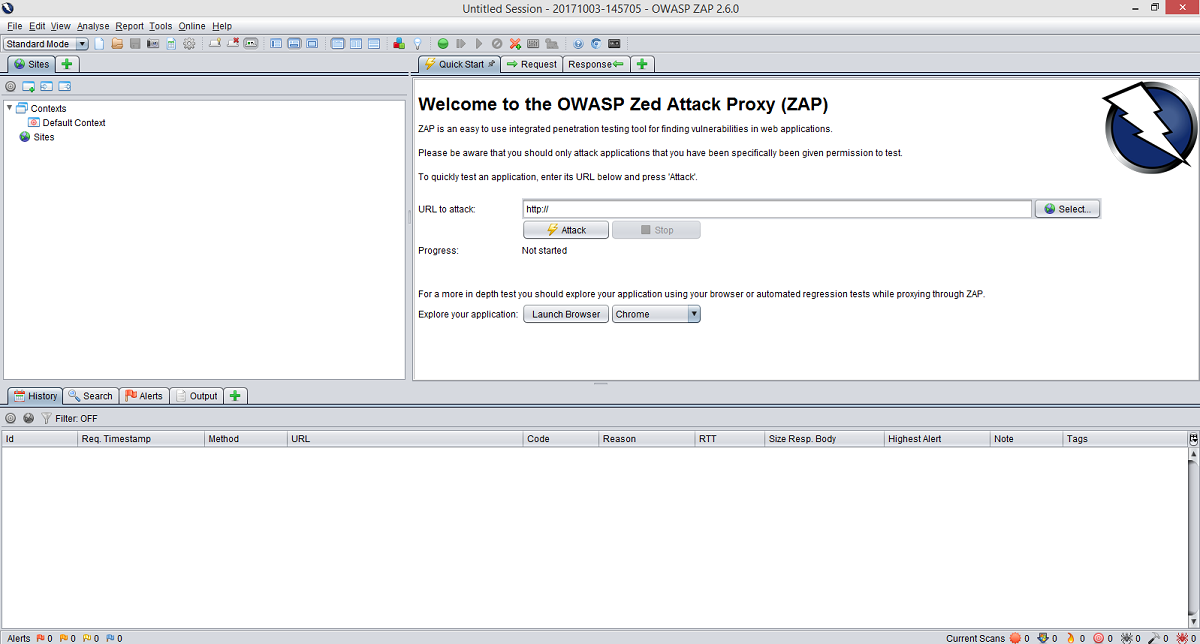
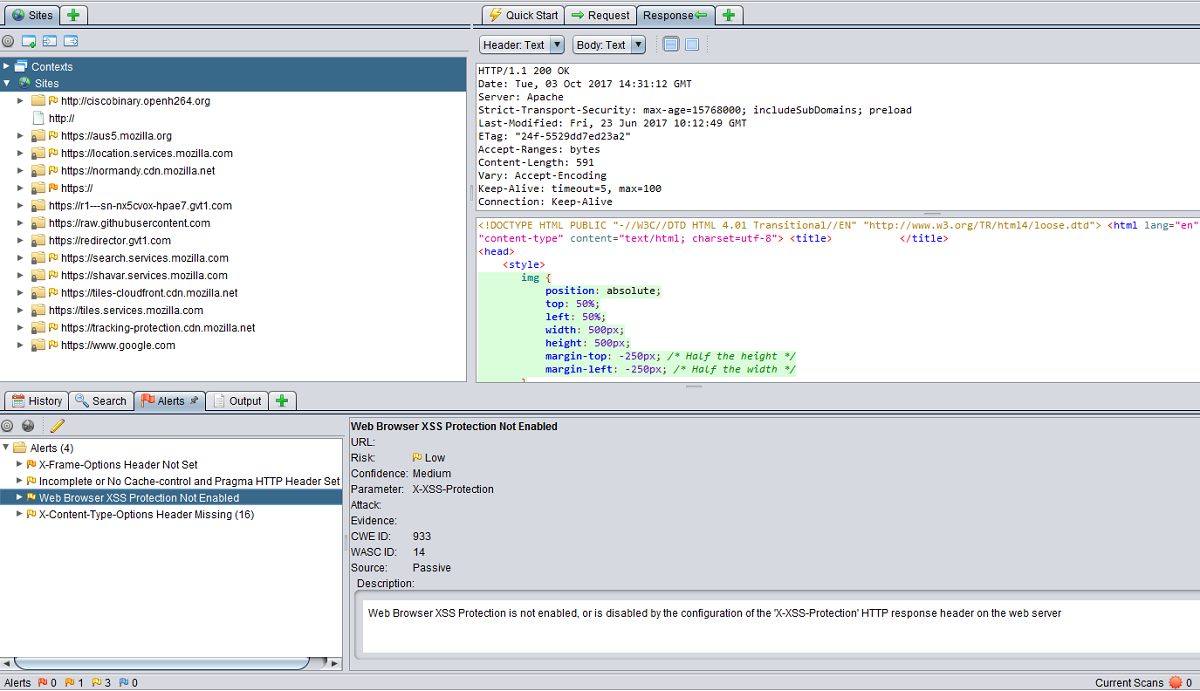
ZAP has a clear and reactive graphical interface (GUI), albeit being quite dense: starting from the upper part of the window we find 4 different areas.
The first is the classic menu bar with options about the current session, modification of data, visualization, analysis, reports, tools and links to reference sites as well as the classic help pages, which can also be accessed with F1 (the documentation, as stated, is very clear and precise: very useful).
In Analyse you can create a scan policy with custom values of actions, and in Tools you’ll find most manual and automated tool, including an Options page.
We then find the toolbar, which contains quick access buttons to the most used actions, and the ZAP operational mode: Safe, Protected, Standard and ATTACK. Special buttons allow to change the graphical visualization of areas, displacing them in the most convenient way according to the ongoing activity.
Understanding how these four modes work is quite important in order to choose the most appropriate one in relation to the activity.
Safe forbids any action that can be potentially dangerous, Protected allows dangerous action on URLs defined in the Scope (which is the set of URLs added to a Context and defines what can be done according to the selected attack mode and what is shown in the History tab), Standard is the usual attack mode and ATTACK performs an active scan on all nodes in the Scope as soon as they are discovered and added.
We suggest to use ZAP in Protected mode in order to limit any unwanted issue: this mode and the Safe mode forbid actions on URLs outside the Scope, such as Spidering, Active Scanning, Breaking and Resending Requests.
Most of the screen is composed by the working area, divided into three sections in its turn: a tree visualization of the site, the main working area (with Request -shows data that the browser/ZAP sends to the site-, Response -received data-, and Break -allows to manipulate data) and an information area. This one has several tabs like History, Alerts, Active Scan and Spider that show, respectively, warnings about found vulnerabilities, ongoing scans and the state of the indexing of the site.
Finally, there’s a footer with information on the state of the session: the number of vulnerabilities found, grouped in terms of level of criticality, and information on the scan.
SSL and Proxy Configuration
ZAP can work as an HTTP Proxy between the user browser and the Web site to analyze. It can also work in presence of other proxies, like in a business scenario.
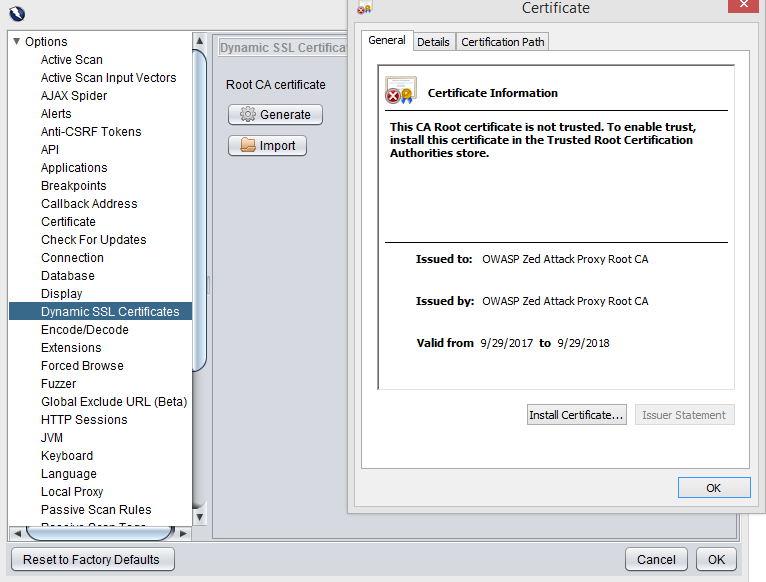
The certificate can be easily exported from the Tools > Options > Dynamic SSL Certificates menu path, then Save it in somewhere in your computer. Be sure that the file has the .cert extension, otherwise it won’t work.
Then install it in the operating system and add OWASP AP as a Root CA Authority: the process depends on the OS you use.
In Windows is as easy as switching back to the previous visualization, pressing View instead of Save, and pressing Install Certificate in the dialog pop-up windows. Then decide whether to install it for the actual user only or for the local machine, select “Trusted Root Certification Authorities” in the Certificate Store and finalize the operation.
Check the proper installation with Panel Control: be sure OWASP Zed Attack Proxy Root CA appears in Internet Options > Content > Certificates > Certificates > Trusted Root Certification Authorities.
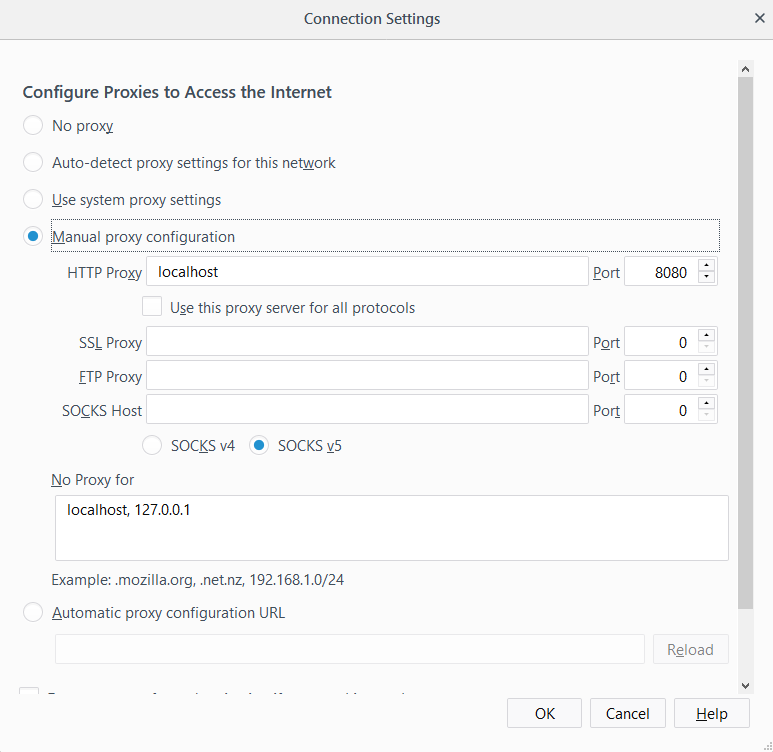
Then configure your browser of choice in order to use ZAP as a proxy.
We have used Firefox 57 and the procedure is as follow: add the certificate in Options > Privacy & Security > Security > Certificates > View Certificates > Authorities > Import.
Then go to Options > General > Network Proxy > Settings and in Manual Proxy Configuration set parameters localhost in HTTP Proxy and 8080 in Port. If the port is not available for some reasons or is already in use, you can specify a different on here and in ZAP (Options > Local Proxy).
These procedures vary from browser to browser, and OWASP offers a precise guide at this address.
Automated Scans
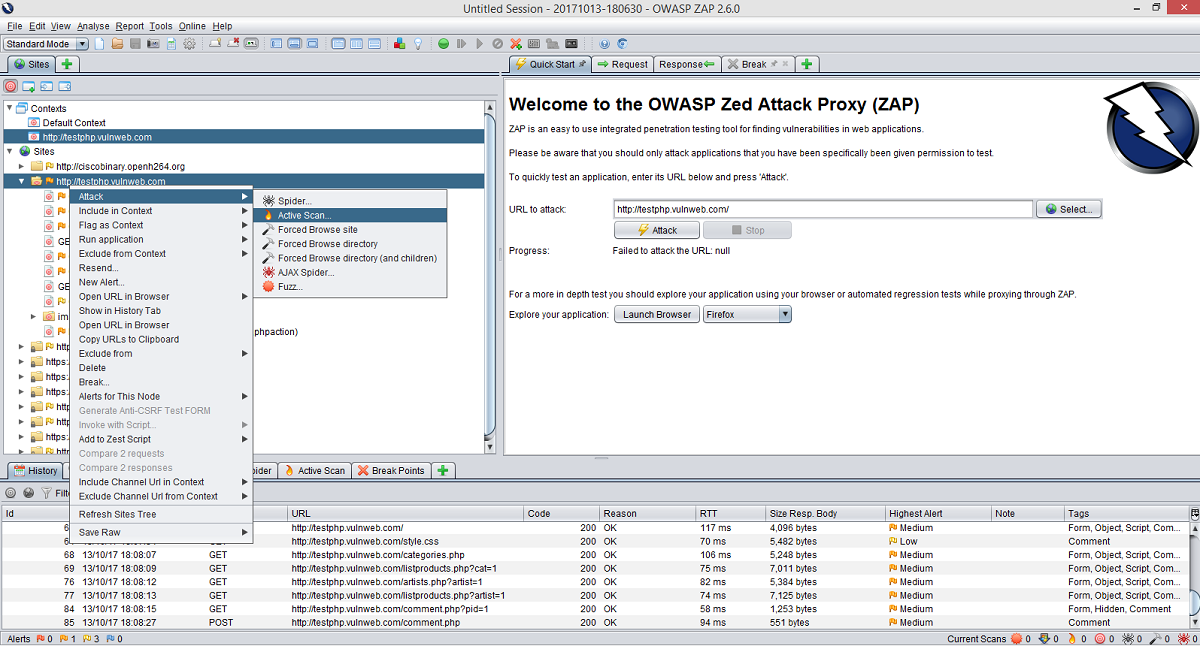
A way of using ZAP consists in an automated scan (or attack) of the site to test: choose the Standard mode, or the ATTACK mode (which differs from the previous as it also scans sites that are automatically added to the Scope), in the toolbar and the URL in the dedicated field of working are (Quick Start tab).
ZAP will start its crawling activity of the site and builds a sitemap, whose state can be checked with the Spider tab, then switches to the attack phase (Active Scan tab).
You can select an element of one of the two aforementioned tabs at any given moment: information about the content of Header and Body parts of requests and responses in the working area.
The footer contains some information: found Alerts on the left, ongoing activities on the right.
If you right-click on an element in the tree visualization, you have access to different options like Alerts for this Node (show issues for this URL), Break (insert a Break Point, ie intercept browser requests and modify them before being sent to the server, so you can understand the behaviour of the app in different conditions), Exclude from (exclude the URL from the proxy, scan or spider: useful when you don’t want to test a certain element), Include in Context and Attack, which in turn offers different options.
AJAX Spider allows to crawl dynamically created pages, and Forced Browse scans all resources that are not referenced by any other resource. Fuzz sends invalid and unexpected data to force non-linear behaviours of the app and analyze them when they deviate from the norm.
Manual Scans
The other use mode is the manual one, with ZAP behaving as a proxy between the browser and the server intercepting all HTTP/S traffic. In this way you can perform certain actions and test precise elements of the Web app: ZAP will record all requests and responses, then it will analyze them and report vulnerabilities if any.
It’s quite useful when verifying the behaviour of specific requests and responses, and of the system when certain input events happen.
Most of what we have seen about automated scans is also true for manual scans, including adding URLs to Contexts and Scopes, actions on single URLs elements and information available within the Alerts, Spider and Active Scan tab.
The main difference is that as we access the website from the browser (configured as shown before), the site tree gets populated with elements that ZAP will analyze, instead of the whole website: there is no general crawling activity.
One of the most interesting features are break-points. Break points allow to intercept a browser request and modify it before it reaches the web app, so to change or disable hidden field, modify data and bypass the so-called “client-side validation” (often enforced with JavaScript). Break points can be set with the dedicated toolbar button or by right-clicking on single elements, then choosing Add a custom HTTP break point.
Analysis and Report of Found Vulnerabilities
Once the scanning phase is over, you typically want to analyze the results.
The easiest and most immediate way to do it is to select the desired website from the site tree window (if several websites are present) and select the Alerts tab.
Here you can find a list of problems grouped per severity -red flag for the critical ones, then orange, yellow and blue as they are less and less important- and typology.
For instance in our test we have found 3 critical vulnerabilities: Cross Site Scripting, Remote File Inclusion and SQL Injection.
Actions and elements that contain a vulnerability are shown by clicking on its typology, with references to the URL, the risk level, a detailed description of the vulnerability itself, a possible remediation and, above all, links to websites and technical documentation, in particular to the one provided by OWASP.
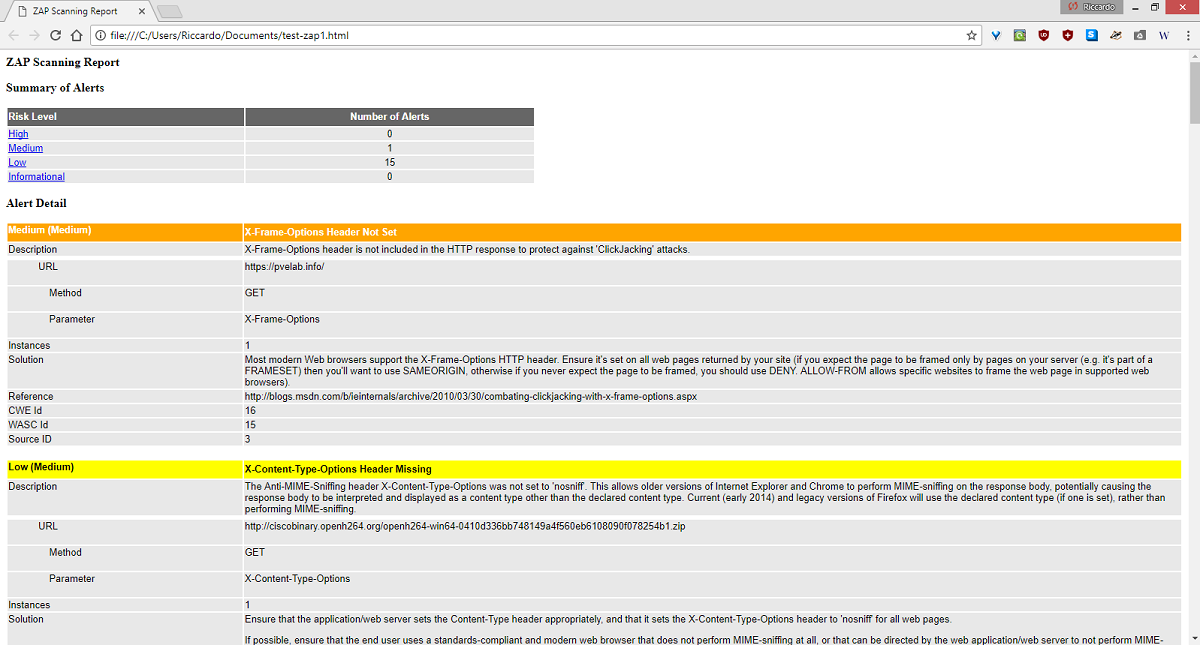
Naturally ZAP has an export feature that allows to export results as a report in HTML, XML and MD (Markdown): go to the menu bar, then Report and choose the most appropriate format.
An interesting capability is to compare the results of two different sessions of the same website, so you can check if a bug has been effectively solved, and which ones need more work.
Going Beyond
ZAP doesn’t end here: there’s a marketplace accessible within the interface with the 3-cube button which offers additional components to enhance ZAP and expand its capabilities. These add-ons are generally in beta and even alpha phase, so they’re typically not ready to be implemented directly in ZAP, yet you can try and test them, and maybe send a few feedbacks to developers. Don’t forget that OWASP ZAP is an open source projects which lives also thanks to users’ contributions.
Then you can invoke ZAP with scripts, as all commands can be accessed via CLI. This way you can automate pentesting procedures, a key concepts as it helps to reduce errors, execution time and the needing of a “manual” start. APIs to interface ZAP with a Web app are available too.
Lastly, ZAP is from OWASP (Open Web Application Security Project), the Web application security online community.
Let’s remember some interesting and useful OWASP projects: WebGoat, “a deliberately insecure Web Application” you can use to be tested with ZAP which also has lessons on the different vulnerabilities, the Top Ten project, an annual report of the 10 most diffuse Web app vulnerabilities (for each one, description, examples, exploitation attack, remediation, prevention and references are provided), a Testing Guide (the pentesting guide of reference), a Development Guide (guide and security best practices in Java, ASP.NET and PHP development), and much more. You can consult a list of projects here.
Conclusions
ZAP is a very complete tool, but it requires a certain degree of proficiency in terms of attack modes and analysis of results, however the documentation provided by OWASP makes the learning process easy.
Being an open source software, you can scrutinise the code to understand how it works and participate in its development, and the marketplace offers many customization with patches provided by developers, users and the community.
A number of tests can be performed in order to have an ample and detailed picture on the state of security of a website or Web app, complete with an analysis of vulnerabilities and issues; a companion technical documentation is also provided in addition to the description and possible remediations for the issues.
Therefore, ZAP is not just a tool for pros, but it’s also an invaluable support for the study of a new, emerging branch of security which is Application Security.
Lastly, ZAP is an OWASP product. OWASP is the point of reference in the Web Application Security world.


