Consistency of performances
Modern SSD disks use internal mechanisms of wear leveling to keep performances constant in time. Those algorithms, if well developed and actualized by a good controller, allow the disk to keep the value of transfer constant thru time, even tough, meanwhile, some mechanisms for the preserveation of speed step in (controller multitasking).
To measure that, we can stress the disk by making a continuous test that last 120 minutes during which the software keeps on writing or reading 4Kb dta blocks with a command queue of 32. The value we are interested in is the number of I/Ops achievable, which should be as steady as possible through time. A decrease after the initial spurt is usual, but the smaller it is, the better the disk performs through time.
Scalability
One of the most interesting parameters for the analysis of and SSD disk and its integrated controller is scalability, that is the capacity of incrementing the performances as the the number of requests or the dimensions of files grow. In our case we analyze in a deeper way the sequencial transfer speed with a 32 commands queue of data with an increasing dimension, from 1 to 2048Kb.
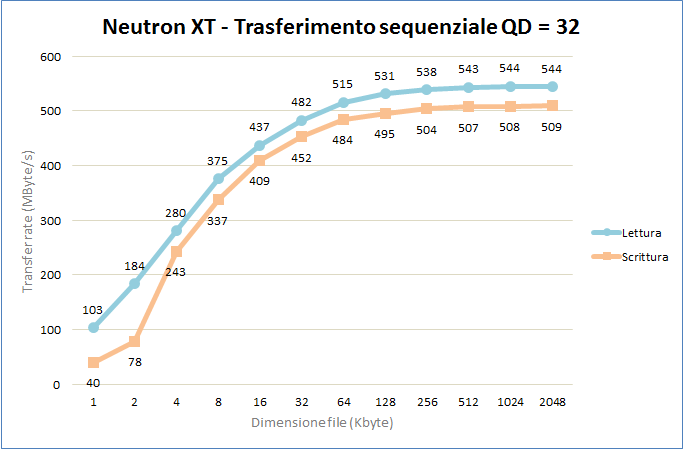
In an ideal model the graph is flat, that means it offers the same performance with any file dimension; in the real world, it’s impossible to reach great speeds with 1Kb data, therefore, the key parameter in the scalability evaluation is the steepness of the curve, which reprensents the necessary time to reach the top speed.
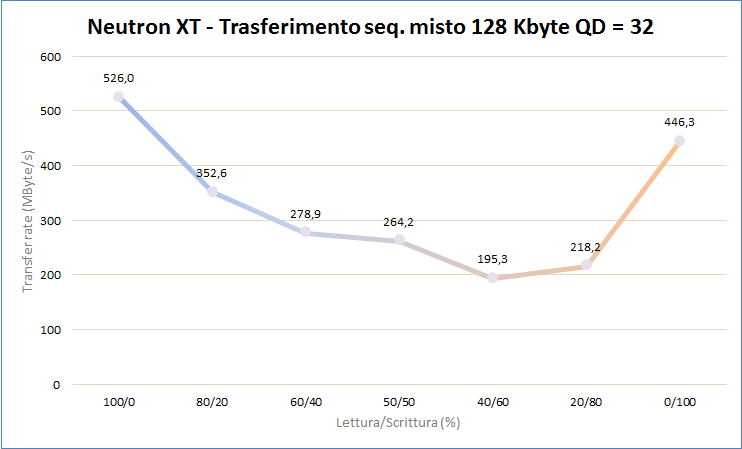
Mixed usage
Obviously no disk is exclusively used to read or write data. In every case we deal with both activities. To evaluate how the controller can handle different activities, we can perform a test in which we transfer 128Kb data blocks with a command queue of 32 and changing the reading/writing ratio, from full reading mode to full writing.
 The two extremes asyntotically follow the maximum sequencial transfer values we previously obtained, while the graph presents a concavity where the mean speed with mixed transaction is way lower than the maximum. The graph should be flat with a perfect controller, but in the real world a performance index can be deduced with the ratio between the minimum and the maximum value.
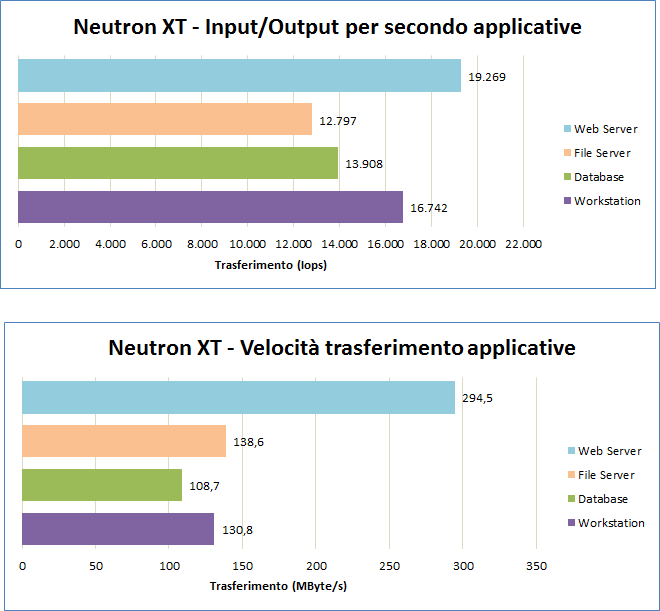
Server and Workstation usage
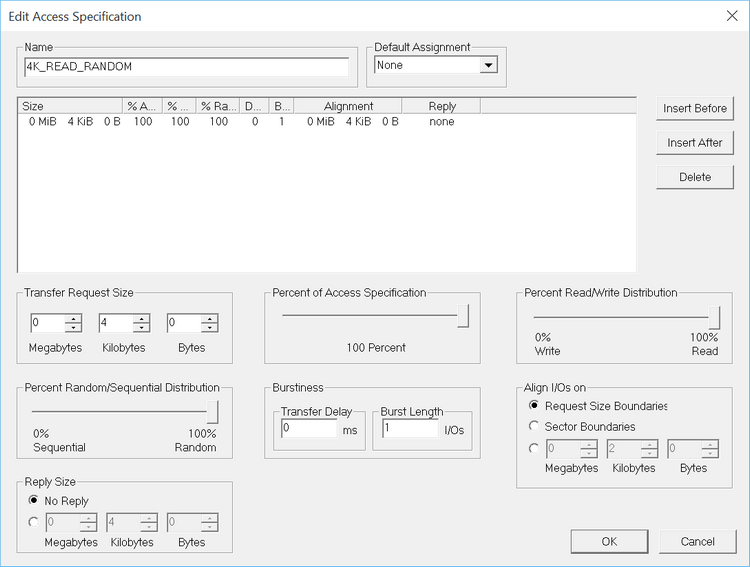
IOmeter can be used to simulate a more realistic usage of the disk with the typical I/O operatons of a Web Server, a File Server, a Database and a Workstation. The table that sums up a typical utilization of ours is this one:
Profili Letture / Scritture Random / Sequenziale Dimensione blocchi Database 67% / 33% 100% / 0% 8 KB - 100% Fileserver 80% / 20% 100% / 0% 512 Bytes – 10% 1 KB – 5% 2 KB – 5% 4 KB – 60% 8 KB – 2% 16 KB – 4% 32 KB – 4% 64 KB – 10% Web server 100% / 0% 100% / 0% 512 Bytes – 22% 1 KB – 15% 2 KB – 8% 4 KB – 23% 8 KB – 15% 16 KB – 2% 32 KB - 6% 64 KB – 7% 128 KB – 1% 512 KB – 1% Workstation 80% / 20% 80% / 20% 8 KB - 100%
In this case we are interested in both I/Ops and tranferring speed. The profiles are different and we can get quite different “rankings” for each disk analyzed.
 As a reference, mechanical disks barely exceed 10Mb/s in the same conditions.

")