The quick resolution of problems is a fundamental activity for any sysadmin. Let’s discover some tricks and advices to become better and faster at diagnosing and resolving troubles of a Linux system.
In the last issues of GURU advisor we dedicated an article to those commands suitable for a basic Linux troubleshooting in a VPS context, but when top, ps and netstat are not enough, we must aim to more advanced tools. Troubleshooting is an activity that can easily transform into a waste of time and resources, proportional to the difficulties of the problems to be solved. In order to optimize the results and limit unuseful trials and tests it’s mandatory to act following well-structured procedures.
![]()
The USE method -which stands for Utilization, Saturation and Errors- was originally conceived by Brendan Gregg (who wrote an omniscient book on the topic: Systems Performance - Prentice Hall, 2013) and has its basis in a simple and efficient idea: defining a workflows that determines the level of utilization, saturation and possible errors for each available resource. In this way we can gradually reduce the number of possible causes of the misbehaviour until we can precisely identify the cause of the loss of performance.
Defining resources is quite easy: they are the physical components of a machine (we can apply the method to software components, but it would get very complicated and detailed -- perhaps a bit too overkill given the scenario), a server in our case -and the equivalent virtual version. Processor, memory, disk, controllers, network interfaces, buses, etc..
Naturally the better the knowledge of the architecture, and the faster and more precise the results will be, albeit implying a certain complexity and a steep learning curve.
Usually the analysis of hardware macro-elements (processor, memory, etc. without going into details) and the exclusion of the software environment, given its additional difficulties, it’s enough to put the USE method into practice.
The definition of utilization, saturation and error is quite subtle, however we can provide some standard definitions and state that: utilization means the proportion of use of a resource, once we set the edges at 0% (the resource is not in use) and 100% (the resource cannot accept any work without adding latency or queue), saturation means the degree of work the resource can’t execute (so it involves latency and queue. Note how utilization and saturation are strictly bounded). For the definition of error, we can refer to the common mean of the term.
Available tools per resource
As the USE method teaches, a proper problem identification and solving job must be based on the analysis of the state of the different system resources by means of specific tools. An overall observation is useful only in the initial phase to have an idea of the steps to follow.
As an Operating System, Linux natively provides several diagnostics tools as command line commands that can be coupled with other tools, like the ones of the sysstat package that we are about to investigate. A detailed installation procedure and the availability depends on the distro in use.
uptime [Load Average]
uptime is a tool that provides information about load average (that is, the average computational work performed by the system) in the last 1, 5 and 15 minutes. Load average considers both processes in runnable state (which use CPU or are waiting to be elaborated) and non-interruptable state (processes waiting for and I/O access, like disk reading data). A load average may be high even with an unloaded processor, for instance when storage is a bottleneck (slow network share, faulty disk, USB peripherals with scarce performances, etc..) and leaves several processes in uninterruptable sleep state waiting for the peripheral.
The number that is showed must be compared to the number of cores available to the system: a value lower than the number of cores indicates a situation without problems (the system can manage the work load without effort), but a value greater that the number of cores indicate a saturation or overload state (that can be, more or less, temporary).
In the practical example shown here, the load average is measured during a stress test with a dedicated tool: in the last minute is 42, which means that the system, a four core server, would need 38 additional cores to execute the work load while keeping the system not overloaded. Once the test is over, the machine shows a way lower value: 0.13, it’s almost in idle state.
dmesg -T | tail [Kernel errors]
dmesg is the command that shows the kernel buffer, which contains information on errors. By concatenating it with the tail command, we can easily consult the last 10 system messages (peripherals, errors, interrupts, etc..) which could offer a clue on why the system has a loss of performances.
vmstat [Virtual memory and detailed information]
The two previous command show generic results about the state of the system, vmstat is more detailed: it offers information about processes, memory, paging, block I/O, disk and CPU activity. The command run without any argument shows information collected since last machine’s boot, while adding the parameter 1 refreshes information every 1 second. Interrupt the screen output by pressing ctrl+C.
Visualization is pretty schematic, the output is organized into groups of columns, each regarding a specific area of the system (processes, memory, swap, I/O, etc..), while the columns to consider are:
- r: the number of active and queued process for each core, a better indicator than load averages found with uptime as it doesn’t include I/O requests. An ‘r’ number greater than the number of cores indicates saturation.
- free: it’s the free (idle) memory in kilobytes. The free command provides additional details.
- si, so: swap in and swap out, respectively, if different from zero mean that memory is swapping to disk.
- us, sy, id, wa, st: there parameters are related to CPU time, as an average on all available CPUs.
They refer, respectively, to user time (time spent executing code not from kernel), system time (time spent executing kernel code), idle time (time spent waiting for an IO request) and stolen time (time ‘stolen’ by a virtual machine).
The sum of the us+sy times indicates whether a CPU is overloaded or not, a constant ‘wa’ number indicates a disk bottleneck: in this case the processor is at rest because tasks are waiting for a disk IO operation that isn’t coming. In order to obtain more detailed information of the different areas of the system, additional commands can be used.
mpstat -P ALL 1 [CPU state]
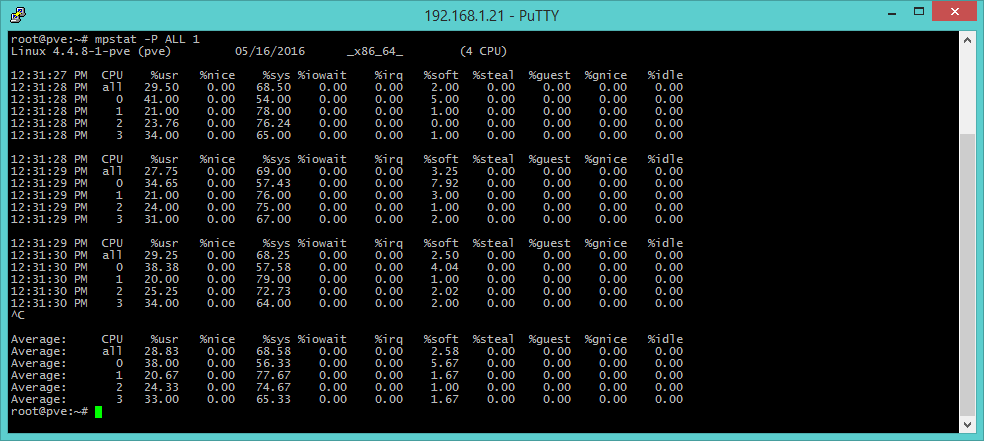
The mpstat command integrates and completes the information about processors by providing detailed data on the activities of each available core (option -P ALL, as a momentary snapshot or each N seconds if a numeric argument is provided). The fields to look for are usr (execution percentage per user), sys (percentage on a kernel basis), iowait (idle time spent waiting for I/O requests), guest (time spent for virtual processes) and idle (time that processor was idle and system didn’t have any disk I/O request).
pidstat [processes]
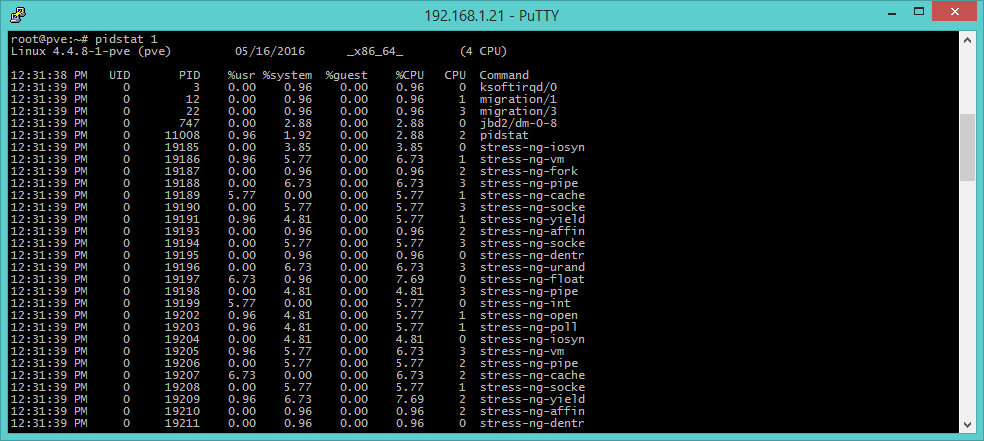
pidstat provides information on active processes managed by the kernel, the parameter 1 -as it happens with other commands- states the amount of time between a report and the following one. The output resembles top’s, but the visualization is structured in momentary tabs instead of a continuous list of reports. In this way we can investigate on patterns that repeat through time, in addition to note results with copy-and-paste.
iostat -xz [Disk I/O]
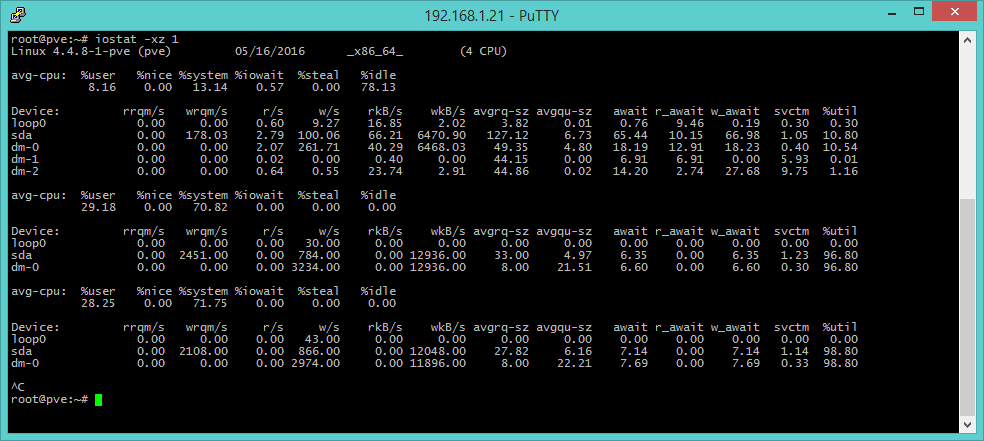
iostat provides information about block devices (disks), useful to understand work loads and performances derived to I/O systems. In the upper part of the output we can find parameter related to the processor, but the area that is of our interest is the next one with the following columns:
- r/s, w/s rkB/s, wkB/s: values about reading and writing operations, Kbyte read and writes per second. They are useful indicators of the work load. Bad performances may depend upon an excessive load.
- await: it’s the time that penalizes an application and includes both queue time and usage time. Values greater than the expected indicate saturation or faults.
- avgqu-sz: it indicates the average requests sent to the device. Value greater than 1 might indicate saturation, while we must keep in mind that some devices can operates with parallel requests, in particular virtual devices that leverage several back-end disks.
- %util: it’s the device usage percentage. A value greater than 60 is a signal of bad performances, 100 indicates saturation, like in the case of a single I/O process continuously accessing the same resource.
The -x argument is used to show extended information, while the -z option excludes devices with no activity in order to offer a better and simpler output consultation. iostat doesn’t work with OpenVZ/Virtuozzo containers.
free –m [memory]
The free command shows several information about the usage state of RAM memory, the -m parameter specified the unit of measure in Megabytes.
Be careful because a superficial analysis of results may be lead to a wrong interpretation. The values of used and free -which are the headers of columns- can be misleading as they indicate, in the case of used memory, the total amount of memory actually used and the memory reserved as buffer for I/O operations. Buffer reserved memory is, indeed, actually available to the system, albeit being “pre-allocated”. Actual usage values are found in the second row, the one identified by the -/+ buffers/cache field.
To make a practical example, an high value of buffers indicates problems on a I/O level (which can be further investigated with the iostat command9. The value used in the Swap row shows if and how much the system is swapping memory on disk.
Some particular situations, like systems with the ZFS file system, show even more unexpected results as they implement a RAM caching system.
sar -n DEV 1 [Network I/O]
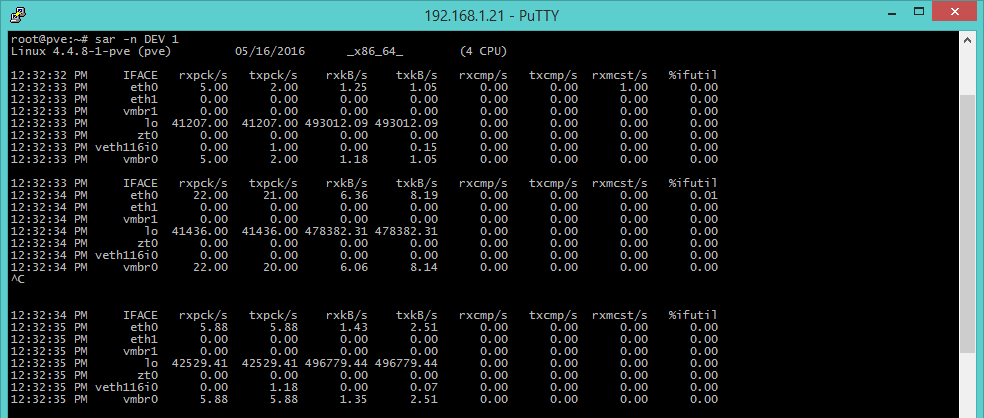
Up to now we’ve dealt with tools that allow to control computing resources, mainly processor, disk and memory, but we often need to evaluate the working state of network connections, and the sar command comes handy. This tool shows statistics on throughput of network interfaces: rxpck/s and txpck/s (received and sent packets per second), rxkB/s and txkB/s (sent and received kilobytes per second), %iful (use percentage of the interface). This last parameter shows the sum of sent and received kB per second, expressed as a percentage on the interface’s speed in case of half-duplex. In case of full-duplex, the parameter to consider is the greater between rxkB/s and trkB/s.
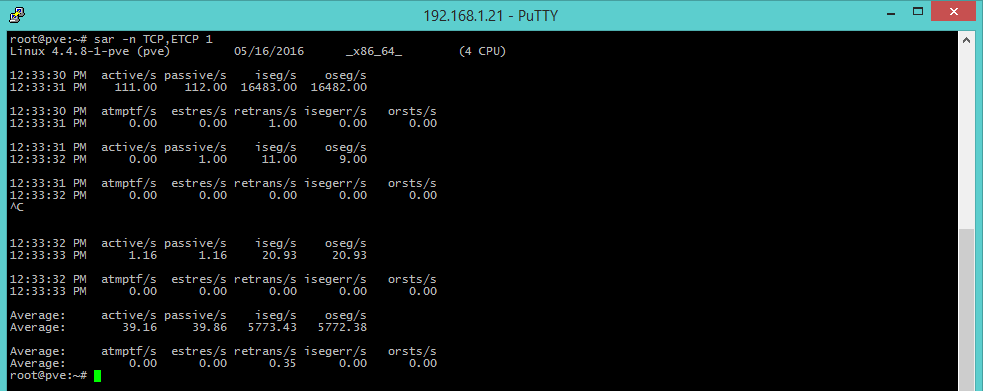
sar -n TCP,ETCP 1 [TCP connections]
The TCP and ETCP (ErrorTCP) options offer metrics about TCP connections that are started per second (active/s), accepted (passive/s) and retransmissions per second (retrans/s). The number of started/accepted connections offer a gross measure of the server’s usage degree, and a high value of retrans means a server-side or network problem: for instance a situation where the server is overloaded and doesn’t accept any more packets, or the Internet connection isn’t stable.
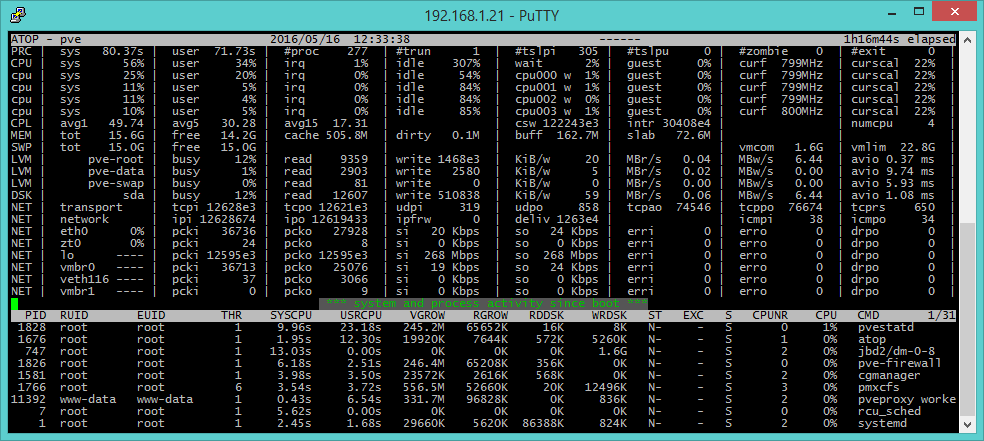
atop [main overview]
atop (the evoluted version of top) provides an overview of the system. The output is divided into two parts: the upper part provide information on a system level, while the lower on single process level. Being an all-around diagnostics tool, some information is the same provided by other tools. For instance avg1, avg5 and avg15 of the CPL (CPU Load) field are the same load averages of the last 1, 5 and 15 minutes offered by uptime. We can also get additional information on processes by pressing some keys: m (information about memory usage), d (disk), n (network, but the netatop module must be installed. See http://atoptool.nl/downloadnetatop.php), c (command line), v (charateristics of processes), u (activities per user) and g (generic, which is the default output). Pressing r reloads the page.
Among the capabilities of atop we can also find logging (logs are usually collected in /var/log/atop/) which makes performances analysis possible also for moments in the past, a feature which is not offered by top.
Furthermore, atop collects information about processes in such a way that almost every process is caught, while top has a system that misses many short-lived process that could make up most of the resource utilization in certain situations.
In this article we have introduced the USE method and analyzed a number of tools to perform troubleshooting in a Linux scenario. With this tools you can identify with a good precision level the causes of loss of performances as well as use use them for planned maintenance routines and system monitoring.


