
Articles of the VPS column:
- VPS: the cores trick
- VPS (second part): the SSD trick
- VPS (third part): evaluating performances
- VPS (fourth part): basic troubleshooting in Linux
Linux is a system equipped with countless diagnostic tools that can be used with a command line interface (CLI) allowing sysadmins to identify and solve problems and malfunctionings. Regardless of the typical limitations of a textual environments, these supporting programs are really powerful as they can be invoked by simple commands or placed into automated scripts. In this article we’ll cover some of the most common: top, ps and netstat.
top and htop: processes, workload and memory under control
top is the command used to identify processes, a clear indicator of the system health state and allows to check parameters such as CPU and memory usage percentage in addition to the actual state of active processes.

Once invoked the command from a cli, a schematic table is displayed with information organized by columns. Despite the sight might be dedicated only to the content of the table, it’s quite important to observe those parameters indicated above it.
Indeed a common situation where a decrease of overall performances can be identified by observing the trend (probably growing) of the load average parameter despite a scarce usage of CPU and RAM. An increase of the wait state (wa) parameter is an indicator of the system difficulty to process instructions.
By analyzing the lower column we can note that processes are represented by their PID (Process IDentifier), while the following columns indicate the user that started the process, its priority, resource usage percentages and other additional parameters.
The graphical level offered by the Linux Shell is in any case quite limited, so an evolute version of top has been implemented: htop. Unlike top, this command is not natively present in Linux, it must be installed using the package manager of your favourite distro.
htop shows up with a significantly evolute graphical dress, still based on the concept of Text User Interface (TUI).
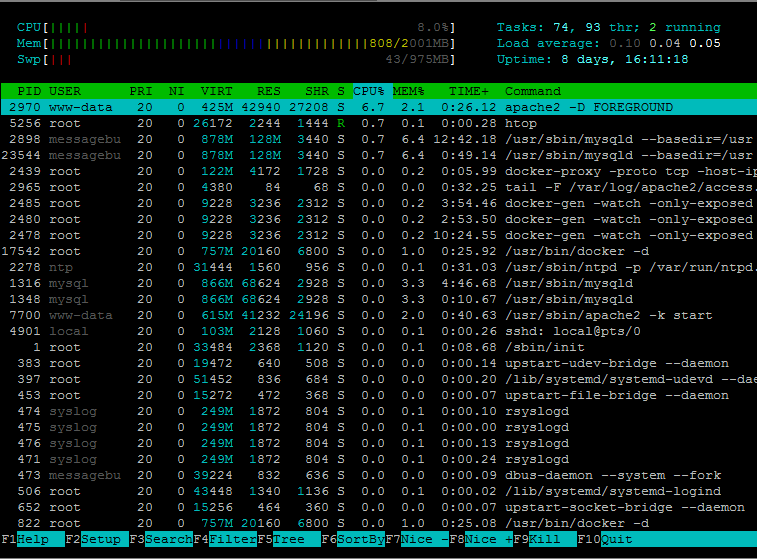
In the upper part, a colored graph has been inserted to show the system load level, and the menu system allows to navigate inside processes, order them, apply filters on the list and perform researches. The processes interaction level has been improved, too: itìs now possible to increase and decrease the priority of a process, in addition to stop it.
ps: a tree of applications
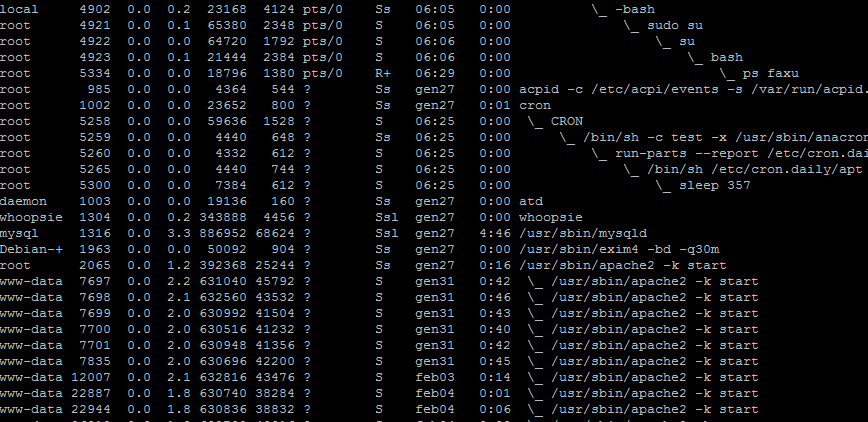
Regarding processes monitoring, the reference command is ps: ps is a tool that allows to visualize a snapshot of executing processes on a user and system basis. Adding the -faxu options shows the process tree and sub-processes with useful information such as user, PID and state of the process.
netstat: who’s connecting to what?
Most active processes in a Linux system establish, or at least use during their activities, one of more network ports. Some signals of a bad system behaviour are often identified by a variation of the state of active connections on a service level, and on usage level too. The nestat command invoked with the –putln shows the actual oper ports and the related service or process.
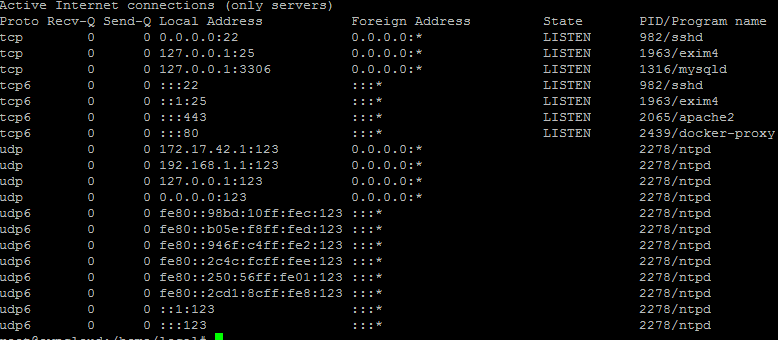
The service usage state on a network level is another potentially useful element to diagnose performance decreases. Lastly, netstat can be piped with the commands grep or wc -l which allows to apply filter on the results and to make a count of the occurrences of established connections.
